Why by Samantha Kleinberg
Author:Samantha Kleinberg
Language: eng
Format: epub
Publisher: O'Reilly Media
Published: 2015-12-14T16:00:00+00:00
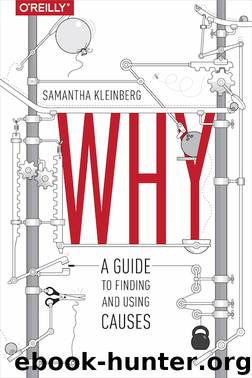
Figure 6-9. Histogram of significance scores for a set of causal relationships. The light grey area (centered on zero, meaning insignificant) represents spurious relationships, and the black bars are genuine causes. Because of noise and other factors, non-causes won’t all have a significance of zero, but will be distributed around that center area.
As usual, for high levels of a causal significance measure to correspond to genuine causes, we need to be sure we measure the strength accurately (so the probabilities are representative of the true ones), and, like in Bayesian networks, that we have measured the shared causes (or else we may overestimate the significance of other causes or find spurious relationships). For time series data we also usually need to assume that the relationships are stationary across time. The reason is that if relationships change over time, then perhaps two variables will be independent for part of the time series but not for another part. When we examine the whole time series together, the relationship may seem weak, even though it may be strong for part of the time.
While we’ve talked about “why,” one thing we’ve glossed over is “when.” In some approaches we can specify a time lag or window, so we can calculate the significance of, say, close contact with someone who has the flu for developing the flu in one to four days. But if we have no idea what causes the flu, how would we know to test just this window? One weakness of some of these methods is that if we test the wrong set of times, we may either fail to find some real causes or find only a subset of the true set of time lags. Testing every conceivable time lag is not a good strategy, since it significantly increases the computational complexity and does not even guarantee that we’ll find the right timings in practice. The reason is that data often are not sampled evenly across time and can be sparse (with few measurements and long gaps between them), and have gaps that are not randomly spaced.
For example, say we have some laboratory test results for a set of patients along with their medication prescriptions. Even if a medication causes blood sugar to go up in exactly one week, the measurements we have will not all (or even mostly) be from exactly one week after the prescription was written. Further, there could also be a delay between the prescription date and when the medication was taken, so a seemingly longer delay between the prescription and glucose being raised may really be only one week after the medication was actually taken. As a result, there may not be enough observations at each single time lag. Using a time window helps (since taken together, we may have a sufficient number of observations around 5–10 days), though we still have the problem of figuring out which time window to test.
One way of recovering the times from data is by starting with a set of potential or candidate timings that are then refined based on the data.
Download
This site does not store any files on its server. We only index and link to content provided by other sites. Please contact the content providers to delete copyright contents if any and email us, we'll remove relevant links or contents immediately.
| Biomathematics | Differential Equations |
| Game Theory | Graph Theory |
| Linear Programming | Probability & Statistics |
| Statistics | Stochastic Modeling |
| Vector Analysis |
Modelling of Convective Heat and Mass Transfer in Rotating Flows by Igor V. Shevchuk(6496)
Weapons of Math Destruction by Cathy O'Neil(6373)
Factfulness: Ten Reasons We're Wrong About the World – and Why Things Are Better Than You Think by Hans Rosling(4796)
A Mind For Numbers: How to Excel at Math and Science (Even If You Flunked Algebra) by Barbara Oakley(3346)
Descartes' Error by Antonio Damasio(3331)
Factfulness_Ten Reasons We're Wrong About the World_and Why Things Are Better Than You Think by Hans Rosling(3271)
TCP IP by Todd Lammle(3234)
Fooled by Randomness: The Hidden Role of Chance in Life and in the Markets by Nassim Nicholas Taleb(3175)
The Tyranny of Metrics by Jerry Z. Muller(3126)
Applied Predictive Modeling by Max Kuhn & Kjell Johnson(3111)
The Book of Numbers by Peter Bentley(3010)
The Great Unknown by Marcus du Sautoy(2731)
Once Upon an Algorithm by Martin Erwig(2694)
Easy Algebra Step-by-Step by Sandra Luna McCune(2668)
Lady Luck by Kristen Ashley(2612)
Police Exams Prep 2018-2019 by Kaplan Test Prep(2595)
Practical Guide To Principal Component Methods in R (Multivariate Analysis Book 2) by Alboukadel Kassambara(2574)
Linear Time-Invariant Systems, Behaviors and Modules by Ulrich Oberst & Martin Scheicher & Ingrid Scheicher(2447)
All Things Reconsidered by Bill Thompson III(2433)
