Machine Learning and Data Science: An Introduction to Statistical Learning Methods with R by Daniel D. Gutierrez
Author:Daniel D. Gutierrez [Daniel D. Gutierrez]
Language: eng
Format: epub
Tags: Data Visualization
Publisher: Technics Publications
Published: 2015-10-09T21:00:00+00:00
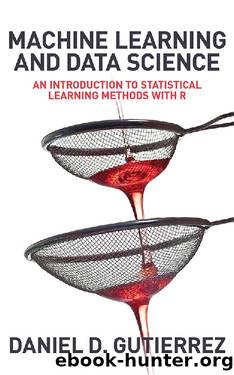
Figure 5-2 Diagnostic plots for the linear regression model for medv and rm
Letâs take a closer look at the plots, as a data scientist can use them to determine the modelâs behavior in making predictions. The first plot is a standard residual plot showing residuals against fitted values. Points that tend toward being outliers are labeled (see point 366 with a value 29.75, point 369 with a value 39.43, and point 373 with a value 31.19). If any pattern is apparent in the points on this plot, then the linear model may not be appropriate. The second plot is a normal quantile plot of the residuals. We like to see the residuals normally distributed. The last plot shows residuals vs. leverage. Labeled points on this plot represent cases we may want to investigate as possibly having undue influence on the regression relationship. Point 366 is one perhaps worth examining further.
Below, weâll display the 366th observation and find the values mdev=27.5 and rm=3.56. But notice that the fitted value for this observation is -2.258, so the residual is quite large at 29.758. The RSE for the model can be retrieved using summary(lm1)$sigma and can then be used to calculate the standardized residual for observation 366, which should be small.
> Boston[366,] # mdev=27.5 rm=3.56
crim zn indus chas nox rm age dis rad tax ptratio
366 4.55587 0 18.1 0 0.718 3.561 87.9 1.6132 24 666 20.2
black lstat medv
366 354.7 7.12 27.5
> lm1$fitted[366]
[1] -2.258
> lm1$residuals[366]
[1] 29.758
> summary(lm1)$sigma #RSE â residual standard error
[1] 6.61616
> lm1$residuals[366]/summary(lm1)$sigma
366
4.497777
A commonly used measure of influence is Cookâs Distance, shown in Figure 5-3. Cookâs Distance can be visualized for all the observations in the model using the plot() function below. This measure can be used to estimate the influence of a data point when performing a regression analysis. Specifically, it can indicate data points that are particularly worth checking for validity and indicate regions of the data set where it would be good to be able to obtain more data points. Cookâs Distance measures the effect of deleting a given observation. Data points with large residuals (outliers) and/or high leverage (identifying those observations that are far away from corresponding average predictor values) may distort the outcome and accuracy of a regression. Points with a large Cookâs distance are considered to merit closer examination in the analysis.
> par(mfrow=c(1,1))
> plot(cooks.distance(lm1))
Download
This site does not store any files on its server. We only index and link to content provided by other sites. Please contact the content providers to delete copyright contents if any and email us, we'll remove relevant links or contents immediately.
Algorithms of the Intelligent Web by Haralambos Marmanis;Dmitry Babenko(19524)
Azure Data and AI Architect Handbook by Olivier Mertens & Breght Van Baelen(7713)
Building Statistical Models in Python by Huy Hoang Nguyen & Paul N Adams & Stuart J Miller(7710)
Serverless Machine Learning with Amazon Redshift ML by Debu Panda & Phil Bates & Bhanu Pittampally & Sumeet Joshi(7572)
Driving Data Quality with Data Contracts by Andrew Jones(7369)
Data Wrangling on AWS by Navnit Shukla | Sankar M | Sam Palani(7332)
Machine Learning Model Serving Patterns and Best Practices by Md Johirul Islam(7068)
Weapons of Math Destruction by Cathy O'Neil(6373)
Learning SQL by Alan Beaulieu(6349)
Big Data Analysis with Python by Ivan Marin(6005)
Data Engineering with dbt by Roberto Zagni(4979)
Solidity Programming Essentials by Ritesh Modi(4634)
Time Series Analysis with Python Cookbook by Tarek A. Atwan(4452)
Pandas Cookbook by Theodore Petrou(4138)
Blockchain Basics by Daniel Drescher(3644)
Natural Language Processing with Java Cookbook by Richard M. Reese(3208)
Hands-On Machine Learning for Algorithmic Trading by Stefan Jansen(3110)
Learn T-SQL Querying by Pam Lahoud & Pedro Lopes(2987)
Feature Store for Machine Learning by Jayanth Kumar M J(2969)
