R Cookbook by JD Long
Author:JD Long
Language: eng
Format: epub
Publisher: O'Reilly Media
Published: 2019-07-15T16:00:00+00:00
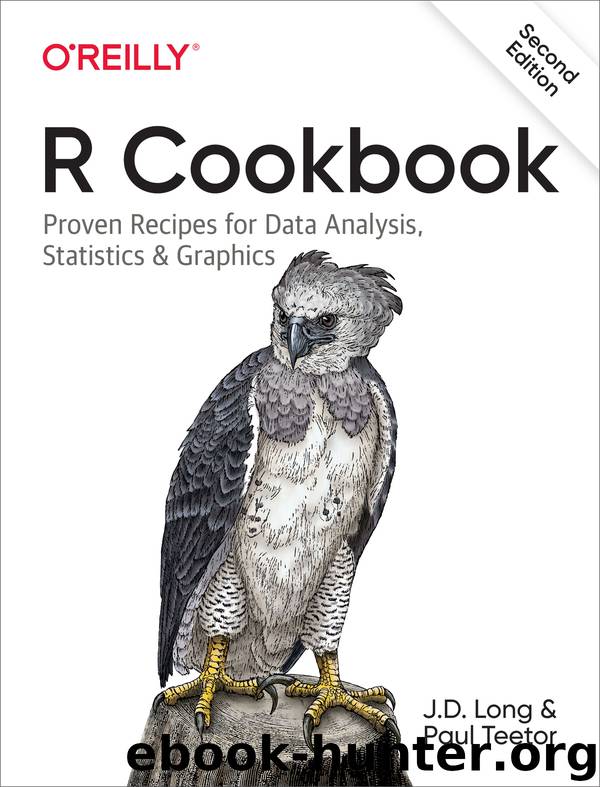
data(Cars93, package = "MASS") ggplot(Cars93, aes(MPG.city, Horsepower)) + geom_point() + facet_wrap( ~ Origin)
Figure 10-26. Cars93 data with facet
The resulting plot reveals a few insights. If we really crave that 300-horsepower monster, then we’ll have to buy a car built in the USA; but if we want high MPG, we have more choices among non-USA models. These insights could be teased out of a statistical analysis, but the visual presentation reveals them much more quickly.
Note that using facet results in subplots with the same x- and y-axis ranges. This helps ensure that visual inspection of the data is not misleading because of differing axis ranges.
Download
This site does not store any files on its server. We only index and link to content provided by other sites. Please contact the content providers to delete copyright contents if any and email us, we'll remove relevant links or contents immediately.
| Coding Theory | Localization |
| Logic | Object-Oriented Design |
| Performance Optimization | Quality Control |
| Reengineering | Robohelp |
| Software Development | Software Reuse |
| Structured Design | Testing |
| Tools | UML |
The Mikado Method by Ola Ellnestam Daniel Brolund(27123)
Hello! Python by Anthony Briggs(25975)
Secrets of the JavaScript Ninja by John Resig Bear Bibeault(25321)
Kotlin in Action by Dmitry Jemerov(24421)
The Well-Grounded Java Developer by Benjamin J. Evans Martijn Verburg(23613)
Dependency Injection in .NET by Mark Seemann(23333)
OCA Java SE 8 Programmer I Certification Guide by Mala Gupta(21964)
Algorithms of the Intelligent Web by Haralambos Marmanis;Dmitry Babenko(20871)
Grails in Action by Glen Smith Peter Ledbrook(19889)
Adobe Camera Raw For Digital Photographers Only by Rob Sheppard(17087)
Test-Driven iOS Development with Swift 4 by Dominik Hauser(12602)
Becoming a Dynamics 365 Finance and Supply Chain Solution Architect by Brent Dawson(8131)
Microservices with Go by Alexander Shuiskov(7914)
Practical Design Patterns for Java Developers by Miroslav Wengner(7819)
Test Automation Engineering Handbook by Manikandan Sambamurthy(7790)
Angular Projects - Third Edition by Aristeidis Bampakos(7266)
The Art of Crafting User Stories by The Art of Crafting User Stories(6724)
NetSuite for Consultants - Second Edition by Peter Ries(6640)
Ember.js in Action by Joachim Haagen Skeie(6437)
